 Bitcoin
  Ethereum
  Tether
  BNB
BNB  XRP
XRP  USDC
USDC  Solana
  Figure Heloc
  Dogecoin
  USDS
USDS  WhiteBIT Coin
  Bitcoin Cash
  LEO Token
  Wrapped stETH
  Cardano
  Hyperliquid
  Wrapped Bitcoin
  Binance Bridged USDT (BNB Smart Chain)
  Ethena USDe
  Canton
  Stellar
  Wrapped eETH
  USD1
USD1  sUSDS
sUSDS  Zcash
Zcash  Litecoin
  MemeCore
  Coinbase Wrapped BTC
  Avalanche
  WETH
WETH  Hedera
  Shiba Inu
  Sui
Sui  USDT0
USDT0  Toncoin
  Bittensor
  World Liberty Financial
  Circle USYC
  PAX Gold
  Ethena Staked USDe
 Bitcoin Climbs 9% Towards $70,000 as Technical Signals Meet Demand Floor
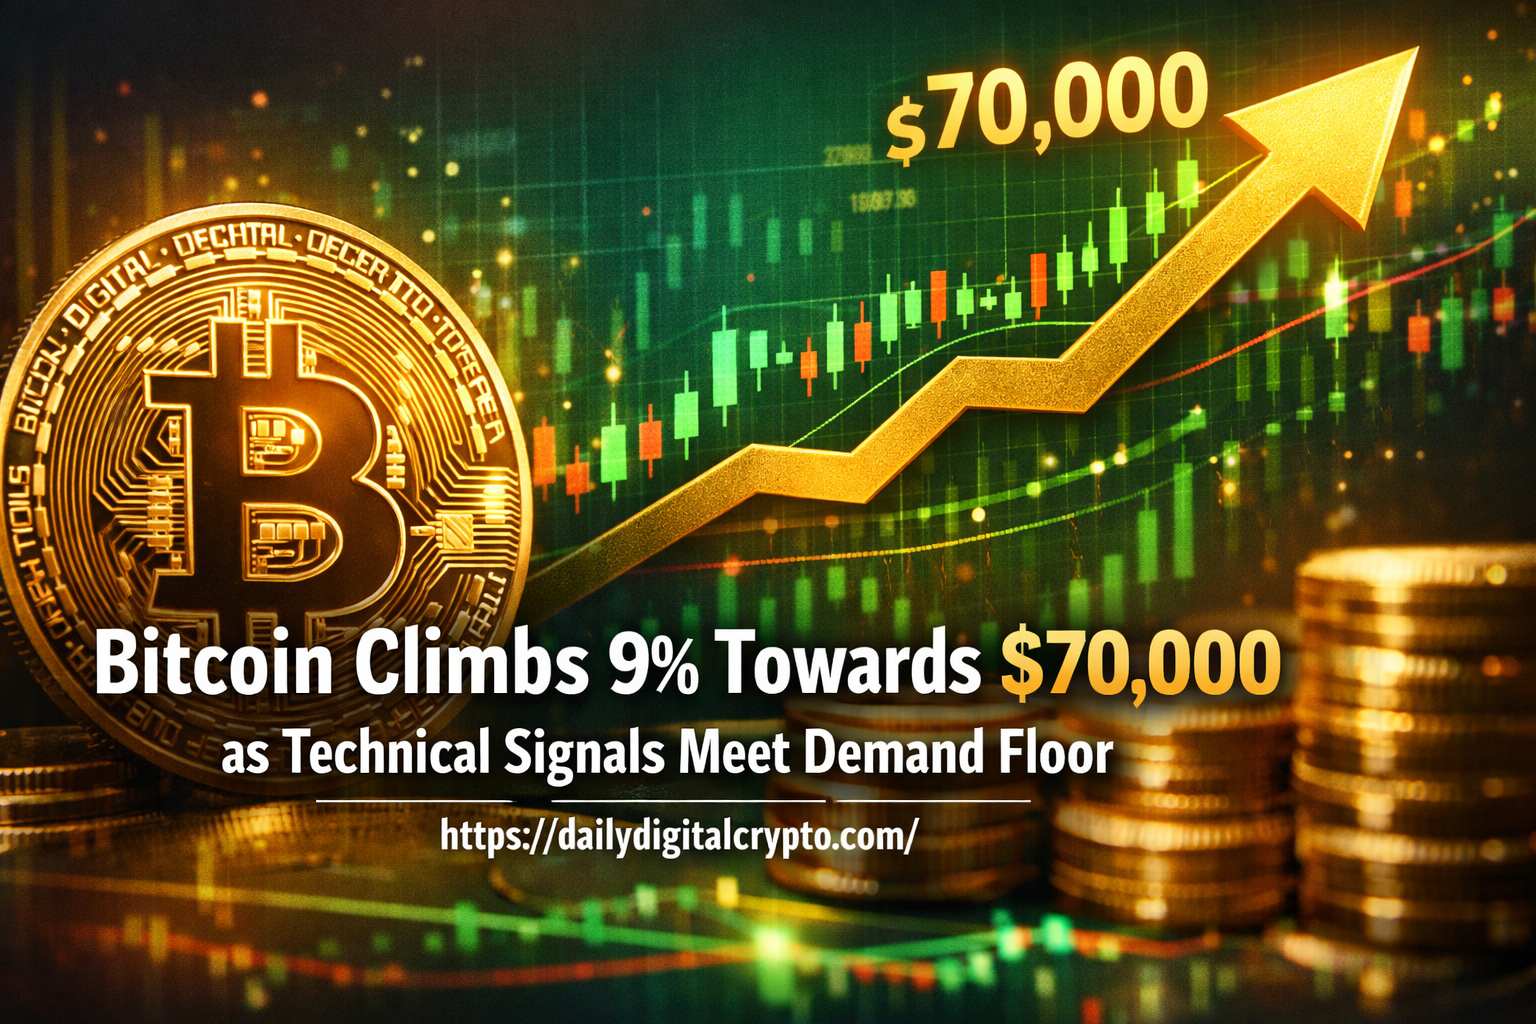
Bitcoin is back in the spotlight and this time, the numbers are impossible to ignore. Bitcoin climbs 9% towards $70,000 as technical signals meet the demand floor, igniting excitement across trading desks and crypto Twitter alike. Whether you’re a seasoned hodler or just dipping your toes into crypto, this move matters.
Bitcoin Climbs 9% Towards $70,000 as Technical Signals Meet Demand Floor, highlighting bullish momentum, strong support levels, and renewed investor interest.
Table of Contents
Quick Summary: Bitcoin’s 9% Surge at a Glance
| Data Point | Details |
| Price Move | ~9% surge toward the $70,000 level |
| Trigger | Technical breakout + demand floor confluence |
| Key Support Zone | $60,000–$62,000 demand floor |
| Resistance Target | $70,000 psychological level |
| Market Sentiment | Bullish — fear turning to optimism |
| RSI Reading | Approaching overbought (65–70 range) |
| Volume | Significantly above 30-day average |
| Institutional Activity | ETF inflows spiking; whale accumulation noted |
What’s Actually Happening With Bitcoin Right Now?
Bitcoin doesn’t move 9% in a vacuum. This kind of explosive upside almost always tells a story and right now, the story is a powerful one.
The price action shows Bitcoin climbing aggressively from a base in the low $60,000s, with momentum pushing it toward the psychologically significant $70,000 mark. The last time Bitcoin flirted with this level was during the euphoric run of late 2024, so traders are understandably buzzing.
Why $70,000 Is Such a Massive Deal
Numbers like $70,000 aren’t just arbitrary they carry enormous psychological weight. Think of it like a town crossing a river; once you’re over, the landscape changes entirely.
At $70K, Bitcoin would confirm a fresh breakout above its previous all-time high territory, attract mainstream media attention all over again, and potentially trigger a wave of FOMO buying from retail investors who sat on the sidelines.
The Two Forces Fueling This Rally
1. Technical Signals Firing on All Cylinders
Traders love a clean chart setup and right now, Bitcoin is serving one up beautifully. Several technical indicators have aligned simultaneously, which is the kind of confluence that makes experienced traders sit up straight.
Here’s what the charts are showing:
- RSI is hovering in the 65–70 range bullish momentum without being dangerously overbought yet.
- The 50-day moving average has crossed above the 200-day moving average a textbook “golden cross” that historically precedes major rallies.
- Volume has surged well above the 30-day average, confirming this isn’t just a low-conviction drift upward.
- MACD shows a fresh bullish crossover on the daily chart.
When this many signals line up at once, it’s rarely a coincidence. The market is sending a clear message.
2. The Demand Floor Holding Like a Rock
Perhaps even more impressive than the technical setup is the demand floor forming in the $60,000–$62,000 range. This zone has been tested multiple times over recent weeks and each time, buyers stepped in decisively. That kind of repeated defense of a support level signals genuine conviction. It means institutional players, not just retail traders, are loading up at these prices.
Who’s Buying? The Institutional Angle
This rally isn’t just Reddit users hitting the buy button. Institutional money is flowing in at a remarkable pace. Spot Bitcoin ETF inflows have spiked noticeably in recent sessions, with billions moving into vehicles like BlackRock’s iShares Bitcoin Trust and Fidelity’s Wise Origin Bitcoin Fund. On-chain data also shows whale wallets those holding 1,000+ BTC accumulating aggressively. That’s the kind of activity that sustains rallies rather than killing them early. Retail FOMO follows institutional conviction, not the other way around.
Also Read: Blockchain Privacy Why It Still Waits on Permission
Bitcoin’s Track Record at Key Psychological Levels
Lessons From $20K, $50K, and $60K
History doesn’t repeat, but it sure rhymes. Here’s what happened the last few times Bitcoin approached massive round numbers:
- $20,000 (2020): After years of resistance, Bitcoin smashed through $20K in December 2020 and never looked back going on to hit $69,000 by November 2021.
- $50,000 (2021): The first test saw a sharp rejection, but the second attempt turned $50K into a trampoline, launching the next leg higher.
- $60,000 (2024): Multiple rejections before the level was finally conquered and flipped to support.
If the pattern holds, $70,000 could be the next level that transitions from ceiling to floor.
What Could Go Wrong? (Risk Check)
No article worth reading ignores the risks. Here are the legitimate reasons to stay cautious:
- Macro headwinds: If the Federal Reserve signals further rate hikes or global risk sentiment sours, crypto could sell off hard regardless of technical setups.
- Rejection at resistance: $70K is a battle zone. A failure to break through convincingly could trigger a sharp pullback to $63,000 or lower.
- Regulatory risk: Any surprise crackdown from the SEC or international regulators could spook the market instantly.
Smart traders size their positions accordingly. Conviction is great but risk management is what keeps you in the game long-term.
What Traders Are Watching Next
If Bitcoin does push through $70,000, the next key levels traders have their eyes on include $72,500 (minor resistance), $75,000 (major psychological level), and $80,000–$85,000 (projected Fibonacci extension targets).
On the downside, a failure to hold $68,000 on a daily close would be an early warning sign that the move is running out of steam.
Frequently Asked Questions
Why is Bitcoin climbing 9% right now?
Bitcoin climbs 9% towards $70,000 as technical signals meet the demand floor meaning strong chart indicators aligned perfectly just as buyers defended a key support zone, sparking a powerful upside move.
Is $70,000 Bitcoin a realistic target?
Based on current momentum, on-chain data, and institutional buying patterns, $70K is absolutely in play. That said, no price target is guaranteed in crypto. Always invest within your risk tolerance.
Should I buy Bitcoin now?
This article isn’t financial advice but the data is genuinely compelling. If you’re considering an entry, watching for a confirmed hold above $68,000 on a daily close would give you stronger confirmation before committing capital.
What is a “demand floor” in Bitcoin trading?
A demand floor is a price zone where buying pressure consistently overcomes selling pressure. Bitcoin’s $60,000–$62,000 area has acted as that floor buyers keep stepping in there, preventing deeper losses and building a base for the rally.
How do technical signals help predict Bitcoin’s price?
Technical signals like RSI, moving average crossovers, and MACD don’t predict the future but they measure momentum patterns that have historically preceded significant moves. When multiple signals align, traders treat that as higher-probability evidence of direction.